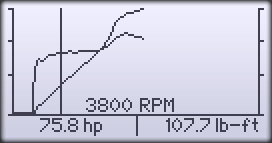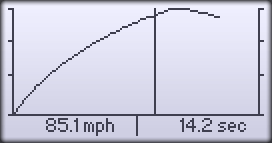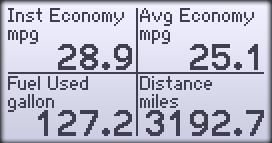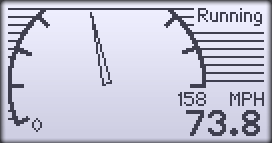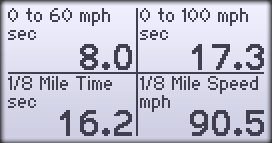


DashDyno Dyno SoftwareAuterra's DashDyno SPD has performance measuring features including horsepower and torque measurements, acceleration tests, gear ratio measurements and a trip computer. The remarkable performance meter features are are an Auterra first! Never before has a product combined the power of a diagnostic scan tool with a performance meter dynamometer package. Auterra vs. Dynojet comparison » Did that engine modification really increase horsepower? What is my vehicle's 0-60 time? How fast is my vehicle on the 1/4 mile? Auterra's DashDyno measures this and a whole lot more! The DashDyno software records speed and RPM signals while the vehicle accelerates through the RPM range. With vehicle and environmental parameters entered, such as vehicle weight, drag coefficient, altitude, and air temperature, the software creates horsepower and torque curves. Environmental factors are corrected for using the industry standard SAE J1349. This dyno correction factor is used to standardize the horsepower and torque readings, so that the effects of air pressure, humidity, elevation, and temperature are removed from the measurements. With this dyno correction factor applied, measurements from a vehicle dyno'ed on a cold day in Denver will produce the same results as a hot day in San Diego. Vehicle factors, such as drag coefficient, frontal area, and vehicle weight, are also compensated for within the software. This means regardless of whether your vehicle has the aerodynamics of a Ford F150 or a Porsche 911, the software correctly measures power and torque. Shown below are a few of the key dyno screens available:
|
||||||||||
|
Auterra OBD II Scan Tools, Performance Meters and Data Loggers Copyright Auterra, LLC All Rights Reserved. | Contact Us | About Us | Home |
